 PT
 EN
 ES
🏀
NBA preseason
These numbers come from preseason games, where starters play limited minutes. The regular season starts on 10/20; from then on, only it counts in the stats
Tue 20/10 · 22:30 (Brasília time)

San Antonio Spurs
home · 2-3
average points scored / allowed
114.4 / 108.8 x 109.8 / 117.0
average total per game: 223.2 · 226.8

Oklahoma City Thunder
away · 1-4
SA · season averages
5 games114.4
pts scored
108.8
pts allowed
223.2
total/game
Latest games (total points)
V
17/10
vs SAC
126-97
223
V
15/10
vs PHX
123-103
226
D
13/10
@ UTAH
109-119
228
D
11/10
@ PHX
98-102
200
D
09/10
vs ATL
116-123
239
OKC · season averages
5 games109.8
pts scored
117.0
pts allowed
226.8
total/game
Latest games (total points)
D
16/10
@ HOU
89-116
205
V
14/10
vs IND
114-112
226
D
12/10
@ ATL
110-113
223
D
08/10
vs MIL
126-128
254
D
07/10
vs NO
110-116
226
🎯 SA attack vs OKC defense
per-game averages: player · OKC defense allows to the position · league
Guards (G)
neutral · defense #13/30 vs G
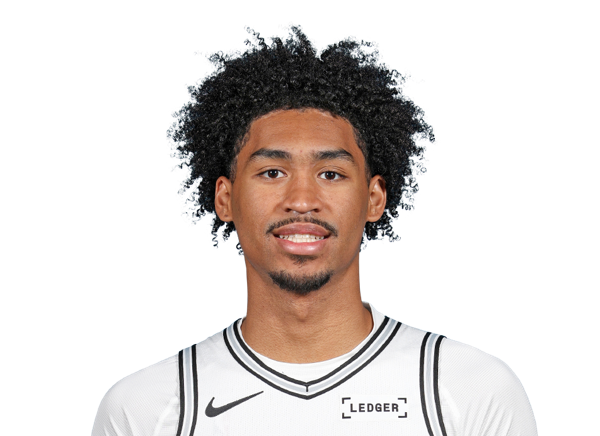
Dylan Harper
G · 4 games · 21.8 min/game
| per game | player | OKC defense allows | league |
|---|---|---|---|
| Points | 14.8 | 54.0 13th | 54.1 |
| Rebounds | 3.3 | 20.0 29th | 14.8 |
| Assists | 3.3 | 17.6 24th | 15.4 |
| Threes | 2.0 | 7.8 19th | 7.5 |
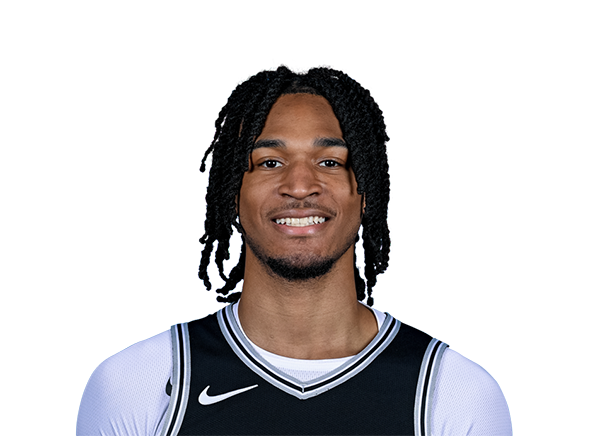
Stephon Castle
G · 4 games · 21.5 min/game
| per game | player | OKC defense allows | league |
|---|---|---|---|
| Points | 14.5 | 54.0 13th | 54.1 |
| Rebounds | 5.0 | 20.0 29th | 14.8 |
| Assists | 4.0 | 17.6 24th | 15.4 |
| Threes | 0.8 | 7.8 19th | 7.5 |
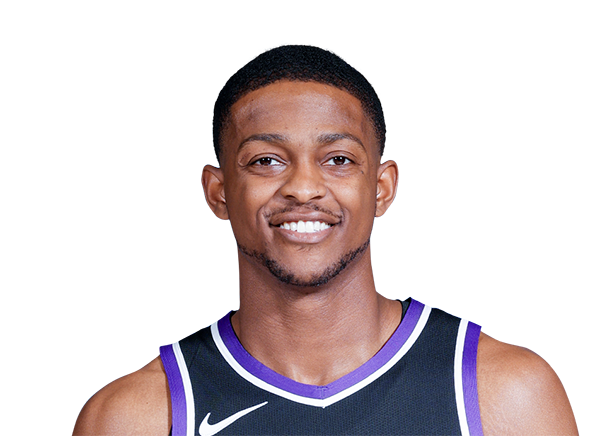
De'Aaron Fox
G · 2 games · 20.5 min/game
| per game | player | OKC defense allows | league |
|---|---|---|---|
| Points | 12.5 | 54.0 13th | 54.1 |
| Rebounds | 4.5 | 20.0 29th | 14.8 |
| Assists | 3.5 | 17.6 24th | 15.4 |
| Threes | 2.0 | 7.8 19th | 7.5 |
Forwards (F)
tough · defense #3/30 vs F
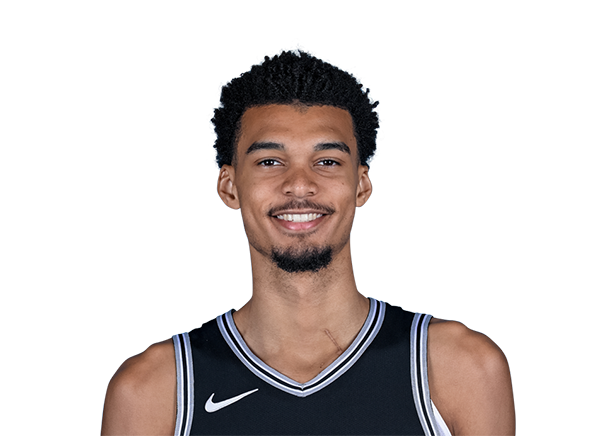
Victor Wembanyama
F · 4 games · 19.8 min/game
| per game | player | OKC defense allows | league |
|---|---|---|---|
| Points | 13.8 | 36.8 3rd | 47.0 |
| Rebounds | 6.3 | 17.6 7th | 20.6 |
| Assists | 3.0 | 7.4 9th | 8.6 |
| Threes | 0.3 | 5.2 14th | 5.4 |
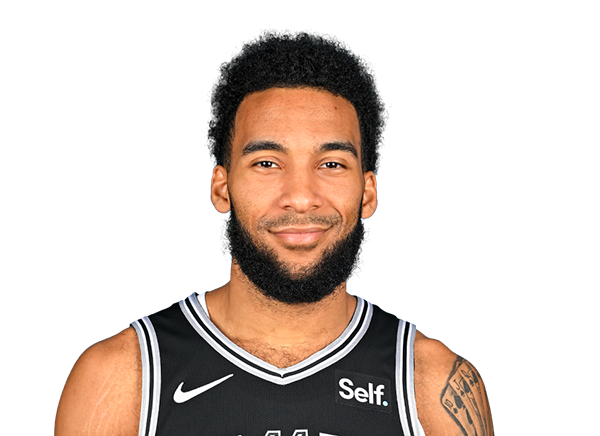
Julian Champagnie
F · 4 games · 21.5 min/game
| per game | player | OKC defense allows | league |
|---|---|---|---|
| Points | 10.8 | 36.8 3rd | 47.0 |
| Rebounds | 2.3 | 17.6 7th | 20.6 |
| Assists | 1.3 | 7.4 9th | 8.6 |
| Threes | 2.5 | 5.2 14th | 5.4 |
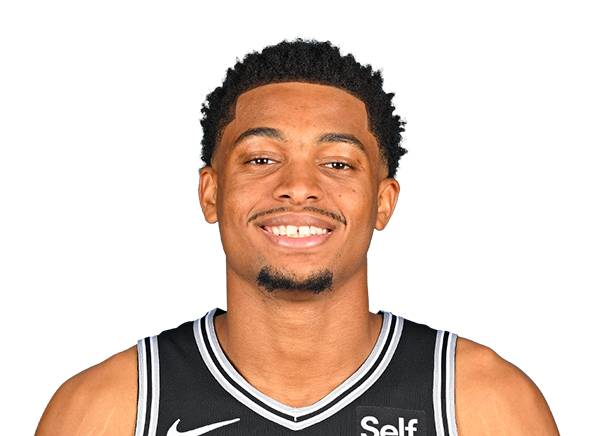
Keldon Johnson
F · 4 games · 19.8 min/game
| per game | player | OKC defense allows | league |
|---|---|---|---|
| Points | 9.8 | 36.8 3rd | 47.0 |
| Rebounds | 4.8 | 17.6 7th | 20.6 |
| Assists | 2.3 | 7.4 9th | 8.6 |
| Threes | 0.3 | 5.2 14th | 5.4 |
Centers (C)
favorable · defense #29/30 vs C

Tarris Reed Jr.
C · 5 games · 17.0 min/game
| per game | player | OKC defense allows | league |
|---|---|---|---|
| Points | 4.4 | 23.6 29th | 14.3 |
| Rebounds | 9.2 | 14.8 30th | 10.1 |
| Assists | 1.0 | 4.8 29th | 2.8 |
| Threes | 0.0 | 1.4 24th | 0.9 |

Luke Kornet
C · 4 games · 16.8 min/game
| per game | player | OKC defense allows | league |
|---|---|---|---|
| Points | 2.8 | 23.6 29th | 14.3 |
| Rebounds | 5.0 | 14.8 30th | 10.1 |
| Assists | 1.3 | 4.8 29th | 2.8 |
| Threes | 0.0 | 1.4 24th | 0.9 |
🎯 OKC attack vs SA defense
per-game averages: player · SA defense allows to the position · league
Guards (G)
neutral · defense #18/30 vs G
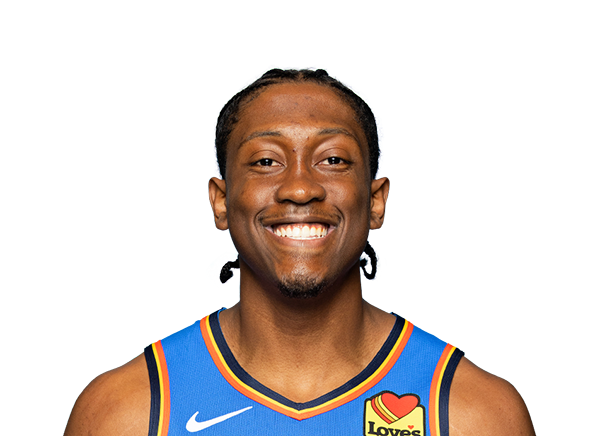
Jalen Williams
G · 3 games · 21.7 min/game
| per game | player | SA defense allows | league |
|---|---|---|---|
| Points | 16.7 | 56.4 18th | 54.1 |
| Rebounds | 4.7 | 17.8 27th | 14.8 |
| Assists | 3.0 | 17.0 22nd | 15.4 |
| Threes | 1.0 | 6.4 9th | 7.5 |

Shai Gilgeous-Alexander
G · 3 games · 22.3 min/game
| per game | player | SA defense allows | league |
|---|---|---|---|
| Points | 16.3 | 56.4 18th | 54.1 |
| Rebounds | 1.3 | 17.8 27th | 14.8 |
| Assists | 4.7 | 17.0 22nd | 15.4 |
| Threes | 2.0 | 6.4 9th | 7.5 |

Bennett Stirtz
G · 5 games · 27.4 min/game
| per game | player | SA defense allows | league |
|---|---|---|---|
| Points | 14.6 | 56.4 18th | 54.1 |
| Rebounds | 3.6 | 17.8 27th | 14.8 |
| Assists | 3.0 | 17.0 22nd | 15.4 |
| Threes | 3.0 | 6.4 9th | 7.5 |
Forwards (F)
tough · defense #9/30 vs F
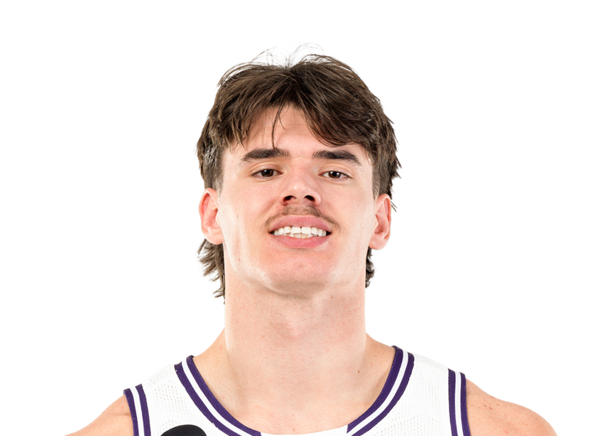
Brooks Barnhizer
F · 5 games · 23.6 min/game
| per game | player | SA defense allows | league |
|---|---|---|---|
| Points | 10.8 | 40.8 9th | 47.0 |
| Rebounds | 4.0 | 14.8 1st | 20.6 |
| Assists | 2.0 | 5.6 4th | 8.6 |
| Threes | 0.8 | 3.0 1st | 5.4 |

Andrew Holifield
F · 4 games · 9.3 min/game
| per game | player | SA defense allows | league |
|---|---|---|---|
| Points | 2.5 | 40.8 9th | 47.0 |
| Rebounds | 1.8 | 14.8 1st | 20.6 |
| Assists | 0.3 | 5.6 4th | 8.6 |
| Threes | 0.0 | 3.0 1st | 5.4 |
Centers (C)
neutral · defense #18/30 vs C
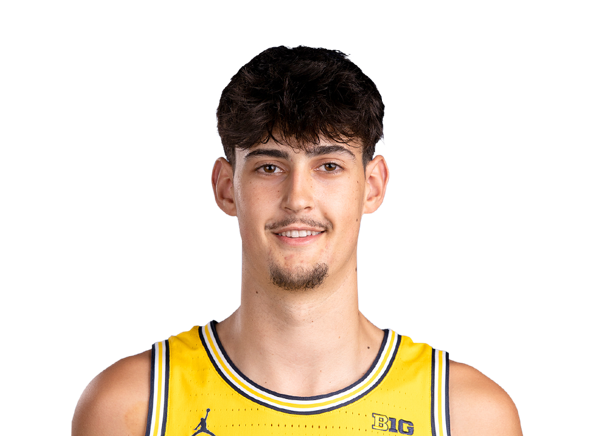
Aday Mara
C · 5 games · 23.2 min/game
| per game | player | SA defense allows | league |
|---|---|---|---|
| Points | 13.4 | 14.5 18th | 14.3 |
| Rebounds | 7.6 | 11.0 19th | 10.1 |
| Assists | 2.8 | 2.3 11th | 2.8 |
| Threes | 0.0 | 1.3 23rd | 0.9 |

Christoph Tilly
C · 5 games · 11.0 min/game
| per game | player | SA defense allows | league |
|---|---|---|---|
| Points | 3.2 | 14.5 18th | 14.3 |
| Rebounds | 2.0 | 11.0 19th | 10.1 |
| Assists | 0.8 | 2.3 11th | 2.8 |
| Threes | 0.2 | 1.3 23rd | 0.9 |
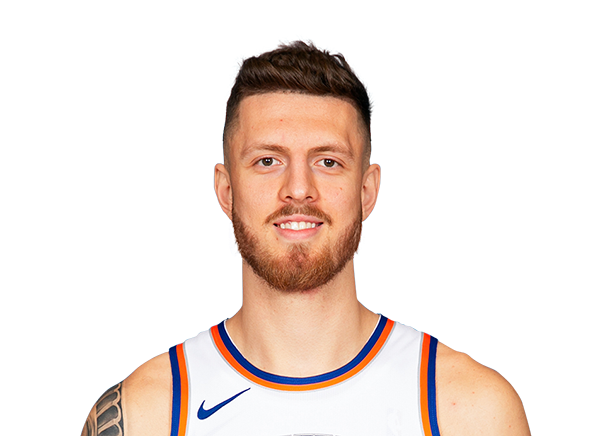
Isaiah Hartenstein
C · 2 games · 16.0 min/game
| per game | player | SA defense allows | league |
|---|---|---|---|
| Points | 3.0 | 14.5 18th | 14.3 |
| Rebounds | 4.5 | 11.0 19th | 10.1 |
| Assists | 1.5 | 2.3 11th | 2.8 |
| Threes | 0.0 | 1.3 23rd | 0.9 |
How to read: "player" is his per-game average this season; "defense allows" is what the opposing defense allows per game to players at that position (G = guards, F = forwards, C = centers), with its ranking (#1 = allows the least); "league" is the average of the 30 defenses. The indicator only groups the defense by ranking thirds. The site makes no projections: the reading is yours.