 PT
 EN
 ES
🏀
NBA preseason
These numbers come from preseason games, where starters play limited minutes. The regular season starts on 10/20; from then on, only it counts in the stats
Wed 21/10 · 20:30 (Brasília time)

Miami Heat
home · 3-2
average points scored / allowed
128.0 / 122.4 x 116.2 / 118.2
average total per game: 250.4 · 234.3

Minnesota Timberwolves
away · 3-3
MIA · season averages
5 games128.0
pts scored
122.4
pts allowed
250.4
total/game
Latest games (total points)
D
16/10
@ ORL
115-136
251
V
14/10
vs BKN
144-128
272
D
11/10
vs MIN
124-125
249
V
08/10
vs NO
128-118
246
V
03/10
@ TOR
129-105
234
MIN · season averages
6 games116.2
pts scored
118.2
pts allowed
234.3
total/game
Latest games (total points)
D
17/10
@ CHI
116-133
249
D
15/10
vs DET
106-128
234
V
12/10
@ NY
122-104
226
V
11/10
@ MIA
125-124
249
D
07/10
@ IND
112-123
235
🎯 MIA attack vs MIN defense
per-game averages: player · MIN defense allows to the position · league
Guards (G)
neutral · defense #14/30 vs G

Pelle Larsson
G · 2 games · 18.0 min/game
| per game | player | MIN defense allows | league |
|---|---|---|---|
| Points | 13.5 | 54.2 14th | 54.1 |
| Rebounds | 2.5 | 15.0 16th | 14.8 |
| Assists | 3.5 | 18.2 28th | 15.4 |
| Threes | 0.0 | 7.0 14th | 7.5 |

Ryan Conwell
G · 5 games · 23.6 min/game
| per game | player | MIN defense allows | league |
|---|---|---|---|
| Points | 13.0 | 54.2 14th | 54.1 |
| Rebounds | 1.8 | 15.0 16th | 14.8 |
| Assists | 4.8 | 18.2 28th | 15.4 |
| Threes | 1.6 | 7.0 14th | 7.5 |
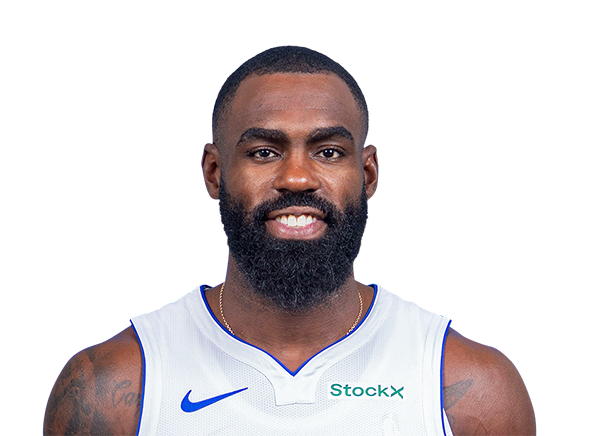
Tim Hardaway Jr.
G · 4 games · 14.8 min/game
| per game | player | MIN defense allows | league |
|---|---|---|---|
| Points | 11.5 | 54.2 14th | 54.1 |
| Rebounds | 1.8 | 15.0 16th | 14.8 |
| Assists | 1.8 | 18.2 28th | 15.4 |
| Threes | 2.0 | 7.0 14th | 7.5 |
Forwards (F)
tough · defense #7/30 vs F

Giannis Antetokounmpo
F · 3 games · 18.7 min/game
| per game | player | MIN defense allows | league |
|---|---|---|---|
| Points | 15.7 | 40.0 7th | 47.0 |
| Rebounds | 7.7 | 17.0 6th | 20.6 |
| Assists | 6.7 | 8.0 14th | 8.6 |
| Threes | 0.0 | 4.7 12th | 5.4 |
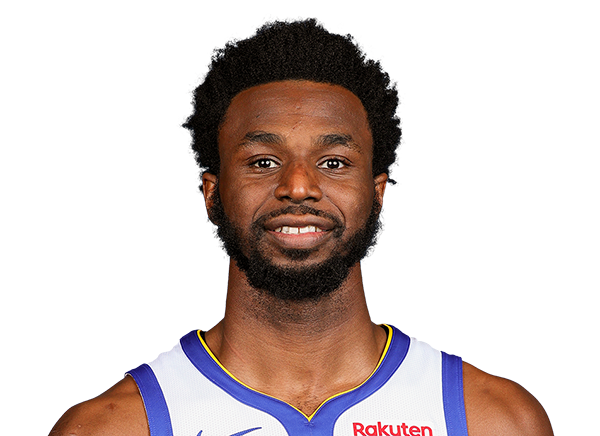
Andrew Wiggins
F · 4 games · 16.3 min/game
| per game | player | MIN defense allows | league |
|---|---|---|---|
| Points | 14.3 | 40.0 7th | 47.0 |
| Rebounds | 2.8 | 17.0 6th | 20.6 |
| Assists | 0.5 | 8.0 14th | 8.6 |
| Threes | 1.8 | 4.7 12th | 5.4 |

Nikola Jovic
F · 5 games · 20.2 min/game
| per game | player | MIN defense allows | league |
|---|---|---|---|
| Points | 10.4 | 40.0 7th | 47.0 |
| Rebounds | 5.6 | 17.0 6th | 20.6 |
| Assists | 3.4 | 8.0 14th | 8.6 |
| Threes | 1.6 | 4.7 12th | 5.4 |
Centers (C)
favorable · defense #26/30 vs C
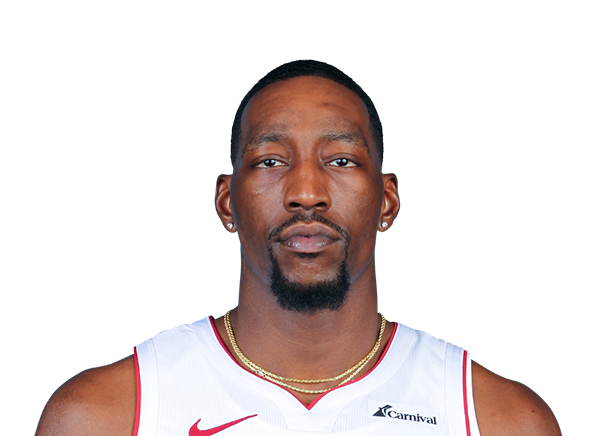
Bam Adebayo
C · 2 games · 14.5 min/game
| per game | player | MIN defense allows | league |
|---|---|---|---|
| Points | 9.5 | 21.5 26th | 14.3 |
| Rebounds | 5.0 | 10.8 18th | 10.1 |
| Assists | 1.0 | 3.0 16th | 2.8 |
| Threes | 1.0 | 1.2 22nd | 0.9 |

Vladislav Goldin
C · 3 games · 12.3 min/game
| per game | player | MIN defense allows | league |
|---|---|---|---|
| Points | 9.3 | 21.5 26th | 14.3 |
| Rebounds | 3.0 | 10.8 18th | 10.1 |
| Assists | 0.7 | 3.0 16th | 2.8 |
| Threes | 0.3 | 1.2 22nd | 0.9 |
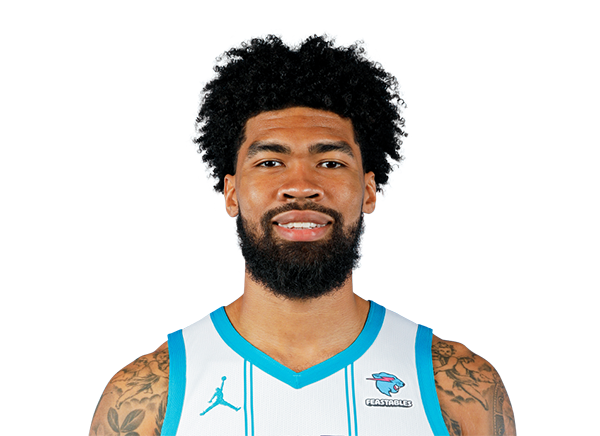
Nick Richards
C · 5 games · 16.8 min/game
| per game | player | MIN defense allows | league |
|---|---|---|---|
| Points | 6.4 | 21.5 26th | 14.3 |
| Rebounds | 8.4 | 10.8 18th | 10.1 |
| Assists | 0.6 | 3.0 16th | 2.8 |
| Threes | 0.2 | 1.2 22nd | 0.9 |
🎯 MIN attack vs MIA defense
per-game averages: player · MIA defense allows to the position · league
Guards (G)
neutral · defense #20/30 vs G
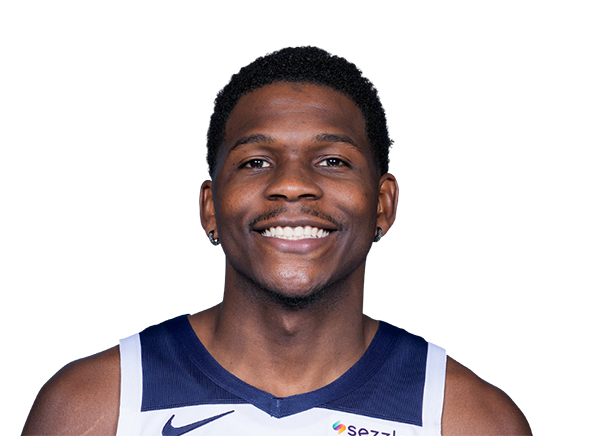
Anthony Edwards
G · 4 games · 22.8 min/game
| per game | player | MIA defense allows | league |
|---|---|---|---|
| Points | 19.8 | 57.0 20th | 54.1 |
| Rebounds | 2.0 | 17.0 24th | 14.8 |
| Assists | 2.3 | 14.4 13th | 15.4 |
| Threes | 2.8 | 10.0 28th | 7.5 |
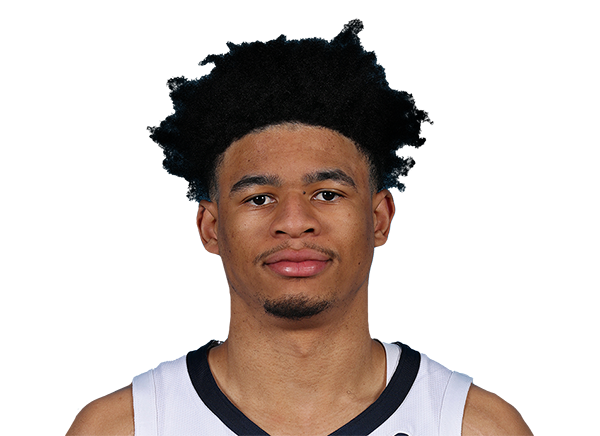
Zyon Pullin
G · 6 games · 19.2 min/game
| per game | player | MIA defense allows | league |
|---|---|---|---|
| Points | 10.8 | 57.0 20th | 54.1 |
| Rebounds | 2.7 | 17.0 24th | 14.8 |
| Assists | 2.7 | 14.4 13th | 15.4 |
| Threes | 0.2 | 10.0 28th | 7.5 |
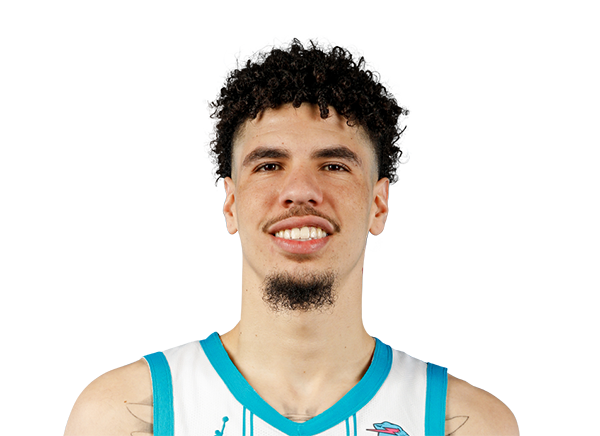
LaMelo Ball
G · 4 games · 19.3 min/game
| per game | player | MIA defense allows | league |
|---|---|---|---|
| Points | 9.5 | 57.0 20th | 54.1 |
| Rebounds | 3.3 | 17.0 24th | 14.8 |
| Assists | 5.8 | 14.4 13th | 15.4 |
| Threes | 2.0 | 10.0 28th | 7.5 |
Forwards (F)
neutral · defense #17/30 vs F
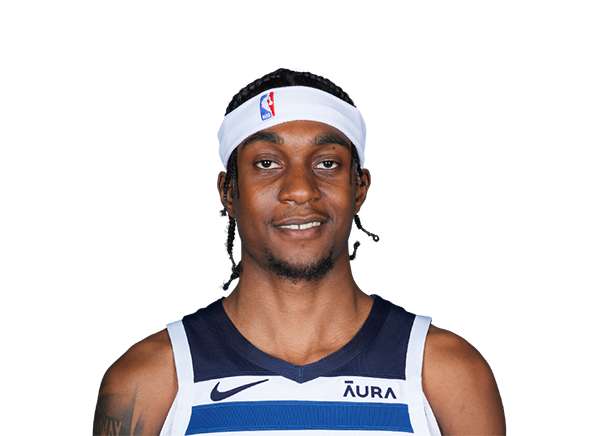
Jaden McDaniels
F · 4 games · 20.8 min/game
| per game | player | MIA defense allows | league |
|---|---|---|---|
| Points | 14.8 | 46.4 17th | 47.0 |
| Rebounds | 4.3 | 19.2 13th | 20.6 |
| Assists | 1.5 | 8.4 15th | 8.6 |
| Threes | 2.5 | 4.6 10th | 5.4 |
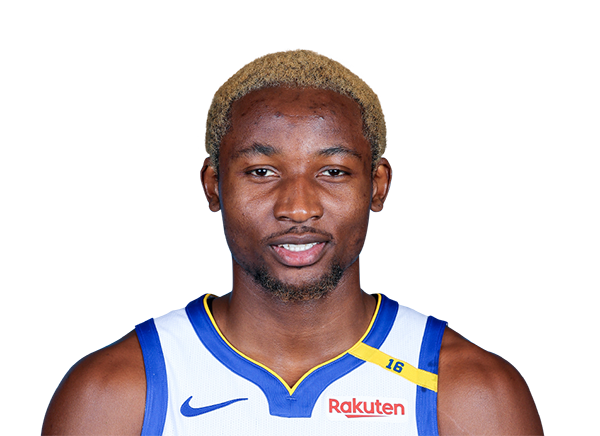
Jonathan Kuminga
F · 3 games · 18.3 min/game
| per game | player | MIA defense allows | league |
|---|---|---|---|
| Points | 8.7 | 46.4 17th | 47.0 |
| Rebounds | 2.3 | 19.2 13th | 20.6 |
| Assists | 2.0 | 8.4 15th | 8.6 |
| Threes | 0.7 | 4.6 10th | 5.4 |
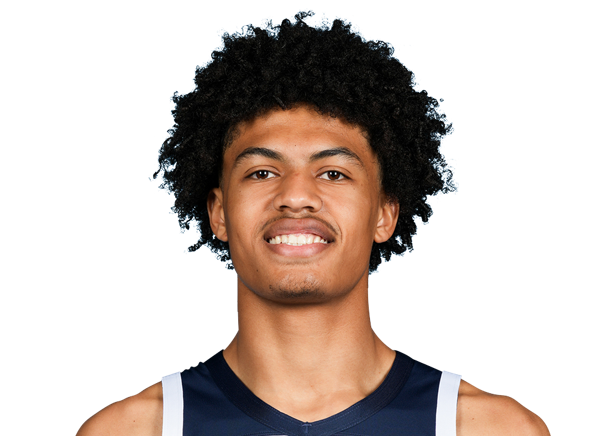
Joan Beringer
F · 6 games · 19.2 min/game
| per game | player | MIA defense allows | league |
|---|---|---|---|
| Points | 8.3 | 46.4 17th | 47.0 |
| Rebounds | 6.5 | 19.2 13th | 20.6 |
| Assists | 0.2 | 8.4 15th | 8.6 |
| Threes | 0.0 | 4.6 10th | 5.4 |
Centers (C)
neutral · defense #17/30 vs C
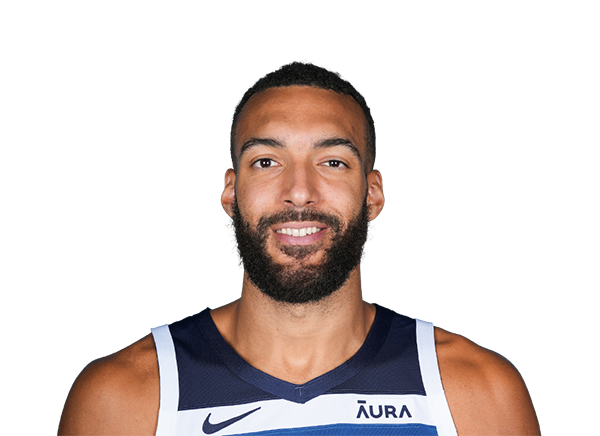
Rudy Gobert
C · 4 games · 20.0 min/game
| per game | player | MIA defense allows | league |
|---|---|---|---|
| Points | 5.8 | 14.2 17th | 14.3 |
| Rebounds | 5.8 | 9.0 12th | 10.1 |
| Assists | 1.5 | 3.2 19th | 2.8 |
| Threes | 0.0 | 0.8 18th | 0.9 |
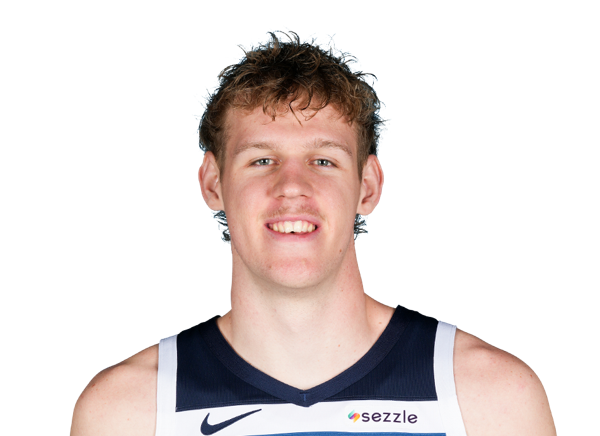
Rocco Zikarsky
C · 2 games · 12.5 min/game
| per game | player | MIA defense allows | league |
|---|---|---|---|
| Points | 2.0 | 14.2 17th | 14.3 |
| Rebounds | 2.0 | 9.0 12th | 10.1 |
| Assists | 1.0 | 3.2 19th | 2.8 |
| Threes | 0.0 | 0.8 18th | 0.9 |
How to read: "player" is his per-game average this season; "defense allows" is what the opposing defense allows per game to players at that position (G = guards, F = forwards, C = centers), with its ranking (#1 = allows the least); "league" is the average of the 30 defenses. The indicator only groups the defense by ranking thirds. The site makes no projections: the reading is yours.