 PT
 EN
 ES
Week 13 · Sun 06/12 · 15:00 (Brasília time)

New York Giants
home · 3-2-1
average points scored / allowed
22.7 / 23.3 x 29.5 / 18.3
average total per game: 46.0 · 47.8

San Francisco 49ers
away · 6-0
NYG · season averages
6 games22.7
pts scored
23.3
pts allowed
46.0
total/game
Latest games (total points)
D
18/10
vs NO
27-34
61
E
11/10
@ WSH
27-27
54
V
04/10
vs ARI
36-24
60
V
27/09
vs TEN
12-7
19
D
22/09
@ LAR
6-28
34
SF · season averages
6 games29.5
pts scored
18.3
pts allowed
47.8
total/game
Latest games (total points)
V
20/10
vs WSH
23-17
40
V
11/10
@ SEA
32-29
61
V
04/10
vs DEN
24-14
38
V
27/09
vs ARI
36-30
66
V
20/09
vs MIA
35-13
48
🎯 NYG attack vs SF defense
per-game averages: player · SF defense allows to the position · league
Quarterbacks
tough · defense #10/32 vs QB
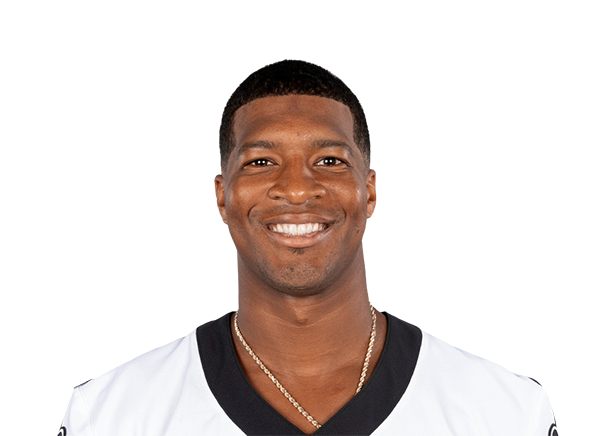
Jameis Winston
QB · 5 games in the season
| per game | player | SF defense allows | league |
|---|---|---|---|
| Passing yards | 191.4 | 225.7 10th | 235.3 |
| Passing TDs | 1.4 | 1.17 9th | 1.5 |

Jaxson Dart
QB · 2 games in the season
| per game | player | SF defense allows | league |
|---|---|---|---|
| Passing yards | 125.0 | 225.7 10th | 235.3 |
| Passing TDs | 1.5 | 1.17 9th | 1.5 |

J.J. McCarthy
QB · 2 games in the season
| per game | player | SF defense allows | league |
|---|---|---|---|
| Passing yards | 121.5 | 225.7 10th | 235.3 |
| Passing TDs | 0.5 | 1.17 9th | 1.5 |
Running backs
tough · defense #10/32 vs RB
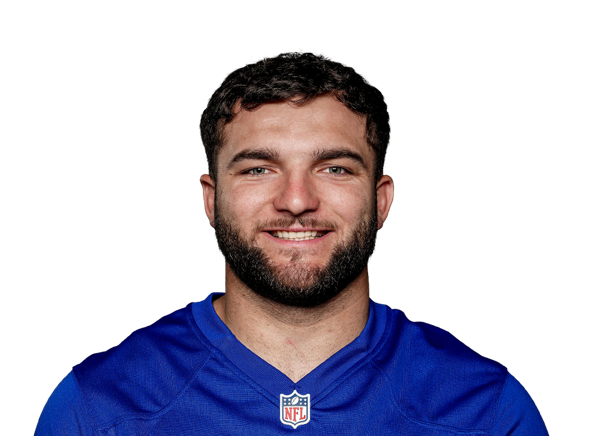
Cam Skattebo
RB · 6 games in the season
| per game | player | SF defense allows | league |
|---|---|---|---|
| Rushing yards | 49.0 | 79.7 10th | 89.7 |
| Rushing TDs | 0.17 | 0.33 3rd | 0.7 |
| Receptions | 1.7 | 7.2 32nd | 4.4 |
| Receiving yards | 13.2 | 46.0 31st | 31.0 |
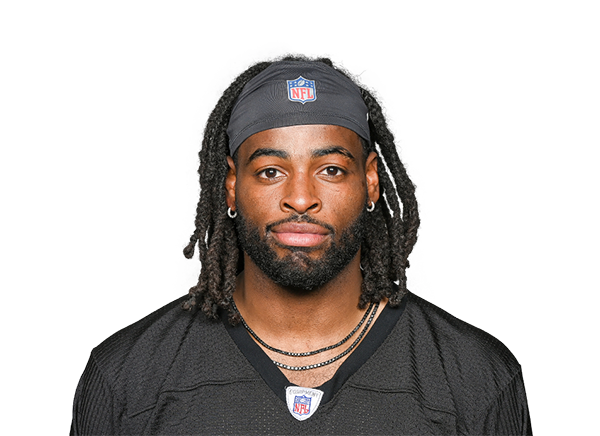
Najee Harris
RB · 5 games in the season
| per game | player | SF defense allows | league |
|---|---|---|---|
| Rushing yards | 19.8 | 79.7 10th | 89.7 |
| Rushing TDs | 0.0 | 0.33 3rd | 0.7 |
| Receptions | 0.2 | 7.2 32nd | 4.4 |
| Receiving yards | 1.0 | 46.0 31st | 31.0 |
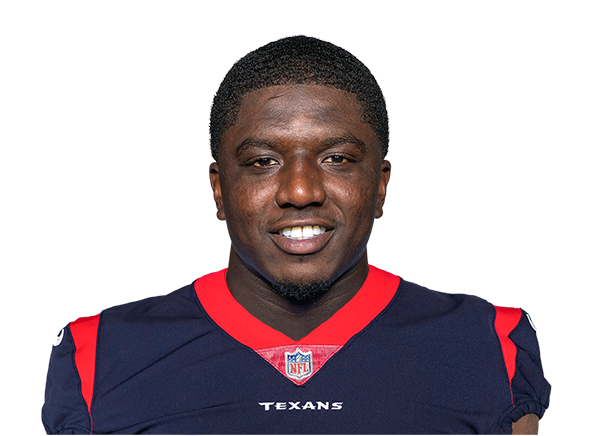
Devin Singletary
RB · 3 games in the season
| per game | player | SF defense allows | league |
|---|---|---|---|
| Rushing yards | 13.0 | 79.7 10th | 89.7 |
| Rushing TDs | 0.0 | 0.33 3rd | 0.7 |
| Receptions | 1.7 | 7.2 32nd | 4.4 |
| Receiving yards | 13.7 | 46.0 31st | 31.0 |
Wide receivers
tough · defense #10/32 vs WR
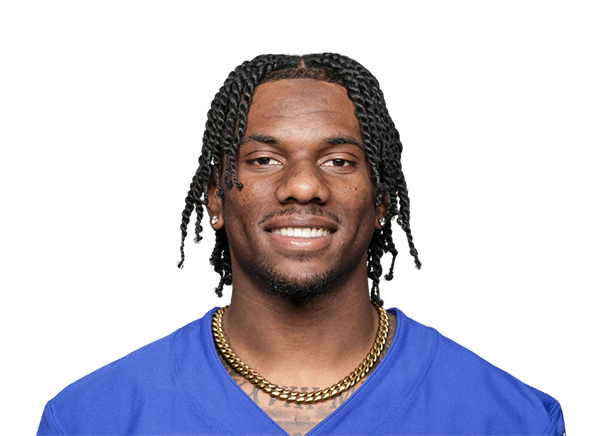
Malik Nabers
WR · 6 games in the season
| per game | player | SF defense allows | league |
|---|---|---|---|
| Receptions | 6.8 | 11.0 15th | 11.6 |
| Receiving yards | 82.3 | 137.8 10th | 150.8 |
| Receiving TDs | 0.33 | 0.83 15th | 0.9 |

Malachi Fields
WR · 6 games in the season
| per game | player | SF defense allows | league |
|---|---|---|---|
| Receptions | 2.0 | 11.0 15th | 11.6 |
| Receiving yards | 27.5 | 137.8 10th | 150.8 |
| Receiving TDs | 0.17 | 0.83 15th | 0.9 |

Charlie Jones
WR · 3 games in the season
| per game | player | SF defense allows | league |
|---|---|---|---|
| Receptions | 0.7 | 11.0 15th | 11.6 |
| Receiving yards | 22.0 | 137.8 10th | 150.8 |
| Receiving TDs | 0.0 | 0.83 15th | 0.9 |
Tight ends
tough · defense #8/32 vs TE
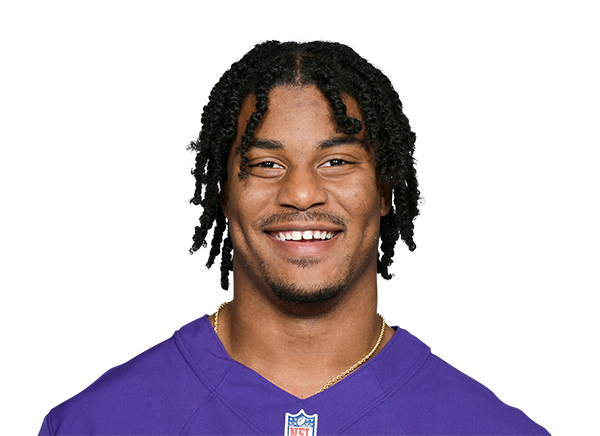
Isaiah Likely
TE · 6 games in the season
| per game | player | SF defense allows | league |
|---|---|---|---|
| Receptions | 6.5 | 5.3 18th | 5.5 |
| Receiving yards | 63.8 | 41.8 8th | 53.6 |
| Receiving TDs | 0.83 | 0.0 2nd | 0.5 |
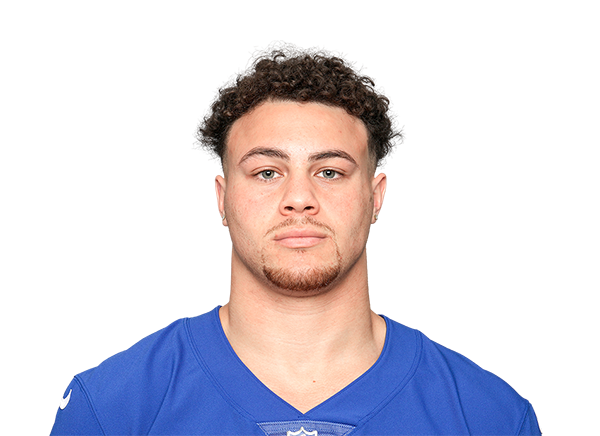
Theo Johnson
TE · 5 games in the season
| per game | player | SF defense allows | league |
|---|---|---|---|
| Receptions | 0.8 | 5.3 18th | 5.5 |
| Receiving yards | 11.0 | 41.8 8th | 53.6 |
| Receiving TDs | 0.2 | 0.0 2nd | 0.5 |
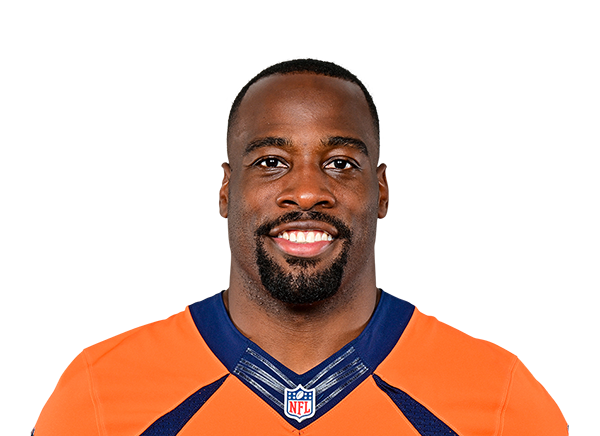
Chris Manhertz
TE · 6 games in the season
| per game | player | SF defense allows | league |
|---|---|---|---|
| Receptions | 0.0 | 5.3 18th | 5.5 |
| Receiving yards | 0.0 | 41.8 8th | 53.6 |
| Receiving TDs | 0.0 | 0.0 2nd | 0.5 |
🎯 SF attack vs NYG defense
per-game averages: player · NYG defense allows to the position · league
Quarterbacks
tough · defense #4/32 vs QB

Brock Purdy
QB · 6 games in the season
| per game | player | NYG defense allows | league |
|---|---|---|---|
| Passing yards | 243.3 | 198.7 4th | 235.3 |
| Passing TDs | 2.33 | 2.0 26th | 1.5 |

Mac Jones
QB · 3 games in the season
| per game | player | NYG defense allows | league |
|---|---|---|---|
| Passing yards | 0.0 | 198.7 4th | 235.3 |
| Passing TDs | 0.0 | 2.0 26th | 1.5 |
Running backs
favorable · defense #29/32 vs RB

Christian McCaffrey
RB · 6 games in the season
| per game | player | NYG defense allows | league |
|---|---|---|---|
| Rushing yards | 58.3 | 107.5 29th | 89.7 |
| Rushing TDs | 1.17 | 0.5 6th | 0.7 |
| Receptions | 4.7 | 3.5 5th | 4.4 |
| Receiving yards | 31.7 | 21.5 5th | 31.0 |
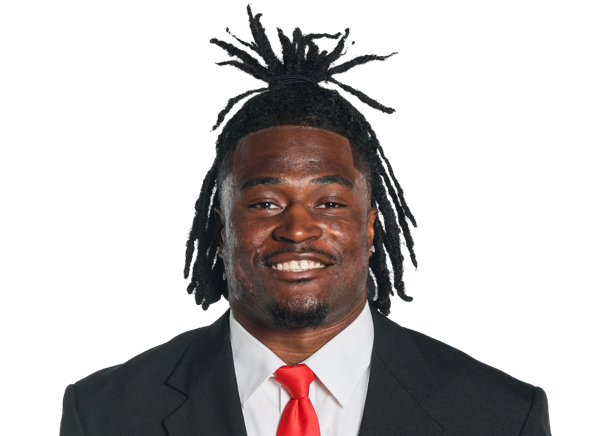
Kaelon Black
RB · 6 games in the season
| per game | player | NYG defense allows | league |
|---|---|---|---|
| Rushing yards | 28.3 | 107.5 29th | 89.7 |
| Rushing TDs | 0.0 | 0.5 6th | 0.7 |
| Receptions | 0.3 | 3.5 5th | 4.4 |
| Receiving yards | 1.3 | 21.5 5th | 31.0 |

Jordan James
RB · 3 games in the season
| per game | player | NYG defense allows | league |
|---|---|---|---|
| Rushing yards | 5.0 | 107.5 29th | 89.7 |
| Rushing TDs | 0.0 | 0.5 6th | 0.7 |
| Receptions | 0.0 | 3.5 5th | 4.4 |
| Receiving yards | 0.0 | 21.5 5th | 31.0 |
Wide receivers
tough · defense #6/32 vs WR
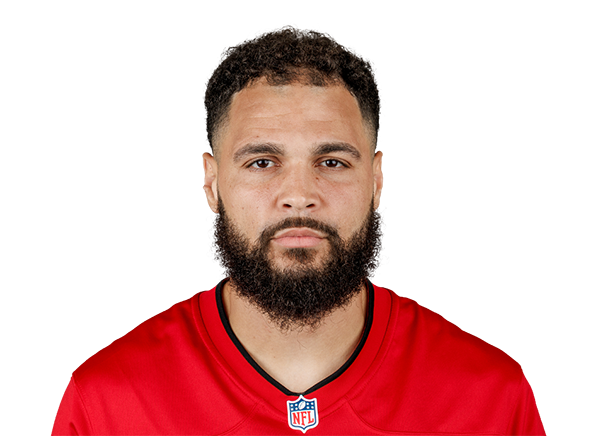
Mike Evans
WR · 6 games in the season
| per game | player | NYG defense allows | league |
|---|---|---|---|
| Receptions | 4.5 | 10.8 12th | 11.6 |
| Receiving yards | 70.0 | 132.3 6th | 150.8 |
| Receiving TDs | 0.5 | 1.17 27th | 0.9 |
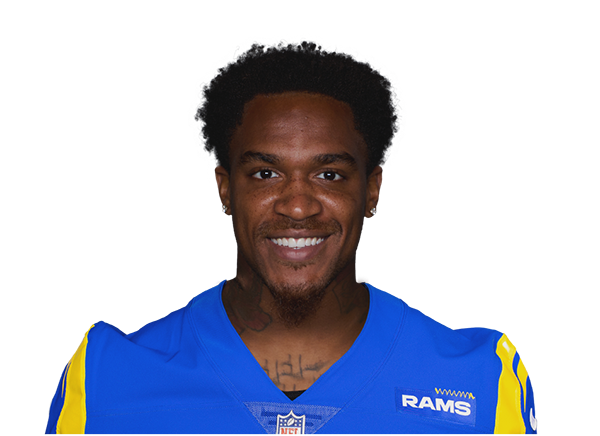
Demarcus Robinson
WR · 2 games in the season
| per game | player | NYG defense allows | league |
|---|---|---|---|
| Receptions | 2.5 | 10.8 12th | 11.6 |
| Receiving yards | 42.0 | 132.3 6th | 150.8 |
| Receiving TDs | 0.5 | 1.17 27th | 0.9 |
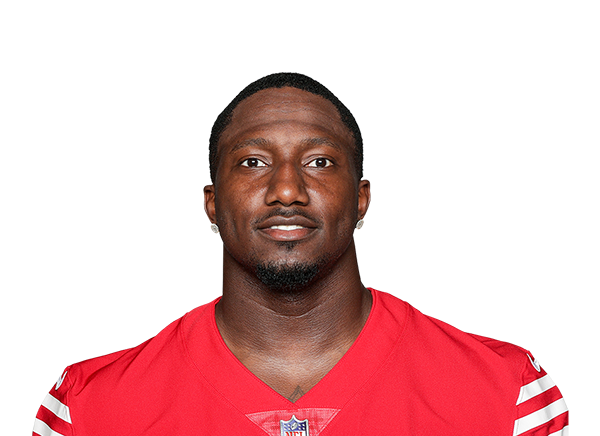
Deebo Samuel Sr.
WR · 5 games in the season
| per game | player | NYG defense allows | league |
|---|---|---|---|
| Receptions | 3.2 | 10.8 12th | 11.6 |
| Receiving yards | 41.2 | 132.3 6th | 150.8 |
| Receiving TDs | 0.6 | 1.17 27th | 0.9 |
Tight ends
neutral · defense #11/32 vs TE

George Kittle
TE · 6 games in the season
| per game | player | NYG defense allows | league |
|---|---|---|---|
| Receptions | 4.3 | 5.8 20th | 5.5 |
| Receiving yards | 56.2 | 44.8 11th | 53.6 |
| Receiving TDs | 0.83 | 0.33 11th | 0.5 |

Luke Farrell
TE · 6 games in the season
| per game | player | NYG defense allows | league |
|---|---|---|---|
| Receptions | 0.3 | 5.8 20th | 5.5 |
| Receiving yards | 3.2 | 44.8 11th | 53.6 |
| Receiving TDs | 0.0 | 0.33 11th | 0.5 |

Jack Stoll
TE · 1 game this season
| per game | player | NYG defense allows | league |
|---|---|---|---|
| Receptions | 0.0 | 5.8 20th | 5.5 |
| Receiving yards | 0.0 | 44.8 11th | 53.6 |
| Receiving TDs | 0.0 | 0.33 11th | 0.5 |
How to read: "player" is his per-game average this season; "defense allows" is what the opposing defense allows per game to players at that position, with its ranking in parentheses (#1 = allows the least); "league" is the average of the 32 defenses. The indicator only groups the defense by ranking thirds. The site makes no projections: the reading is yours.